Hooke's Law: Nonlinear Generalization and Applications
Part 2: Parameters of the Bending Pressure Zone of a Beam
Prof. Dr. Hans Schneeberger
Institute of Statistics, University of Erlangen-Nürnberg, Germany
2021, 9th of February
Keywords: Center of stress β0, stress α0 and strain ε0 of the bending pressure zone in dependence on strength W and loading κ of concrete.
Introduction
The bending pressure zone of a pressed beam is limited by the pressed side and the neutral axis, where the strain ε is zero. If one takes, as is shown in figure 1, a prism, limited by these two boundaries, out of the beam and brings an eccentric loading to the ends, so that the strain ε on the section-side is zero, then one has in the prisma a copy of the disribution of the loading in the bending pressure zone ([3], p.1). See figure 1.

Fig. 1: Equivalence of the bending pressure zone of a beam and an eccentric pressed prism
In figure 2 a sketch of such a prisma is given (copy of [3]).
For comparability I also use the symbols and measures of [3].The problem of the extensive experiments in [3] was to find for different values of cube-strength W(kg/cm2; side length 20 cm) and κ= ![]() (B for break/Bruch) the values of β0, the measure of eccentricity of the loading of the prism in [3] and center of the distribution of the stress, and of the (relative) stress
(B for break/Bruch) the values of β0, the measure of eccentricity of the loading of the prism in [3] and center of the distribution of the stress, and of the (relative) stress ![]() , where Kb is the strength of the prism. These values β0,
, where Kb is the strength of the prism. These values β0, ![]() and ε0(=ε1) are found, when, by varying W and/or κ, ε2 becomes zero.
and ε0(=ε1) are found, when, by varying W and/or κ, ε2 becomes zero.
To this at first for a fixed value of W and a fxed value of β a series experiments was done with growing stress until break.
Then the same was done with prisms (of the same W) and other values of β.
At last step 1 and 2 were done with other values of W.
In detail see [3], figures 48-88.
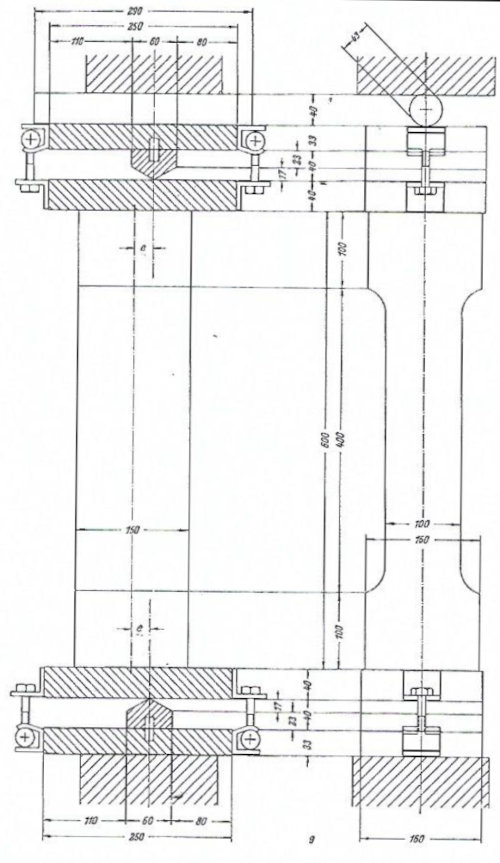
Fig. 2: Details of loading the prisms
With these data the results αP(β), ε2(β) and ε1(β) for different values of κ were plotted for different values of W (see [3], figures 94-107). The essential results are the values β=β0, where ε2=0. Then αP=![]() and ε1=ε0. See figure 3.
and ε1=ε0. See figure 3.
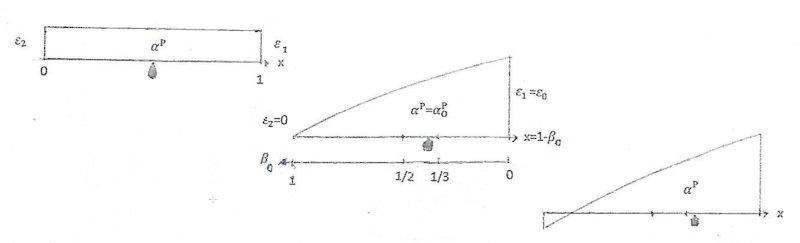
Fig. 3: Parameters strain ε, (rel) stress αP=
![]() /κb (κb is strength of prism) and measure of eccentricity β of loading. Eccentricity e=d(0.5-β); d=150mm
/κb (κb is strength of prism) and measure of eccentricity β of loading. Eccentricity e=d(0.5-β); d=150mm
These results are given in [3], Bild 113, 112, and 114, repeated here as figures 4a, 5a, and 6a and listed in tables 1, 2, and 3. They are the experimental basis for the following analytical hypotheses.
To get truthworthy results it is of decisive importance to disregard non-truhworthy experimental data. Of this sort are the experiments with high loading κ>0.9. See e.g.[3]. p.24, or [2], p.74.
For this reason experimental data with κ>0.9 were ignored in the tables and in the computations.
Hypotheses
Hypothesis H1 for β0 (and the center of loading (1-β0))
![]() 0(w,κ)=1/3+(1/2-1/3)e-α(W/100)κb
0(w,κ)=1/3+(1/2-1/3)e-α(W/100)κb
The parameters a and b are computesd with Gauss' method of least squares:
Q(a,b)=∑(β0i-![]() 0=1/3+1/6 e-0.3374(w/100)κ3.757
0=1/3+1/6 e-0.3374(w/100)κ3.757
The results are given in table 1, lines 2 and especially in figure 4b: ![]() 0(W) for fixed values of κ and in figure 4c:
0(W) for fixed values of κ and in figure 4c:
![]() 0(κ) for fixed values of W. Notice the good correspondence of the hypothesis (curves) with the high number (n=49) of experimental points! Dotted curves are extrapolated.
0(κ) for fixed values of W. Notice the good correspondence of the hypothesis (curves) with the high number (n=49) of experimental points! Dotted curves are extrapolated.
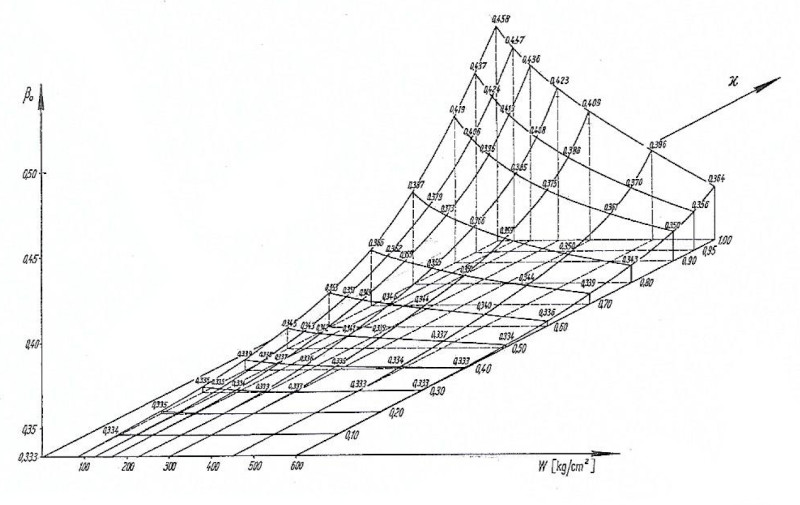
Fig. 4a: Experimental results β0(W, κ) according to [3]
Table 1: first lines: Experimental values β0;, second lines: hypothetical values of![]() 0
0

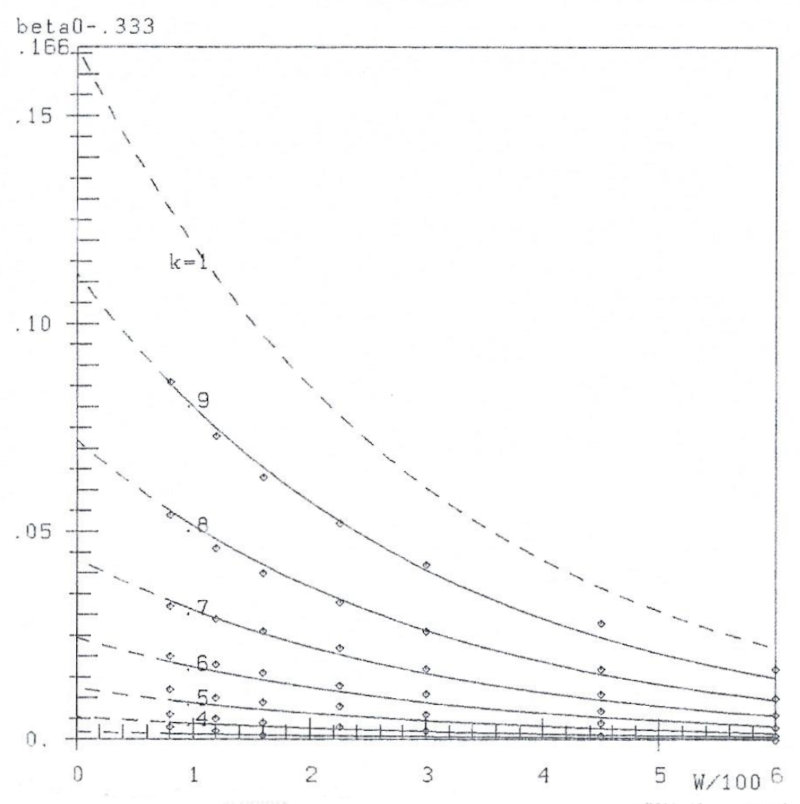
Fig. 4b: Experimental points (W/100, β0-0.333) and hypothetical curves (W/100, ![]() 0-0.333)
0-0.333)
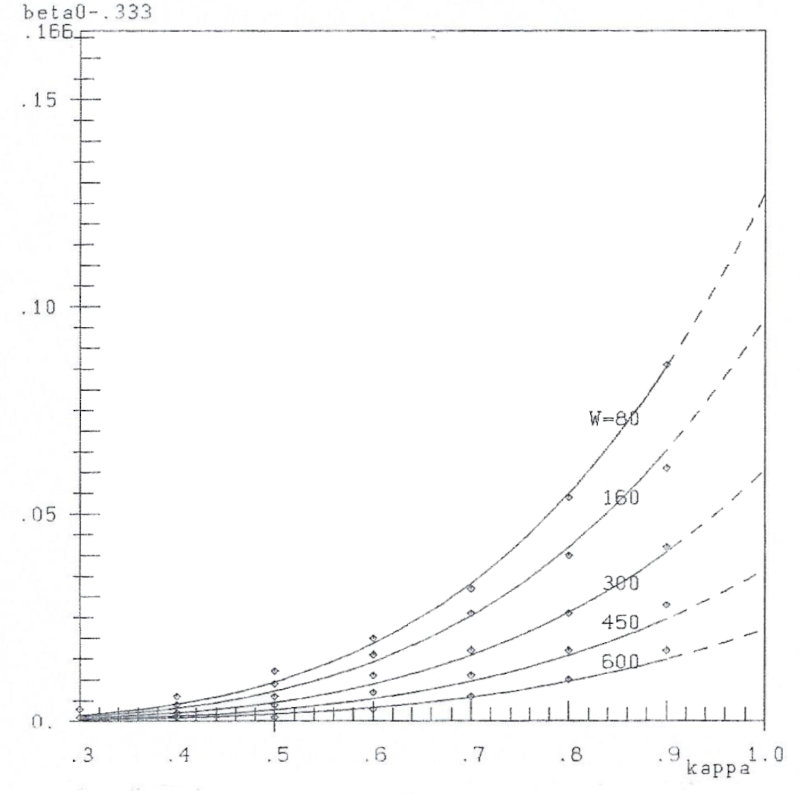
Fig. 4c: Experimental points (κ, β0-0.333) and hypothetical curves (![]() ,
,![]() 0-0.333)
0-0.333)
Hypothesis H2 for the (relative) loading ![]() =
=![]() 0/κb:
0/κb:
![]()
The analogous calculation as with hypothesis H1 , now with the 49 data of table 2 gives:
![]()
The results are given in table 2, lines 2 and in figures 5b and 5c. Especially in figure 5b correspondence of data-poins and hypothetical curves is very convincing- with one exception!
For high loading (κ=0.9) and small values of W. For this also see [3], p.24.

Fig. 5a: Experimental results![]() (W, κ) according to [3]
(W, κ) according to [3]
Table 2: First lines: experimental values ![]() , second lines: hypothetical values
, second lines: hypothetical values ![]()
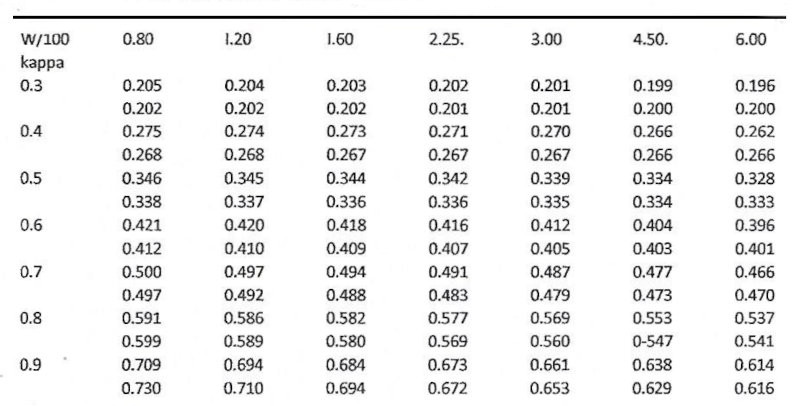
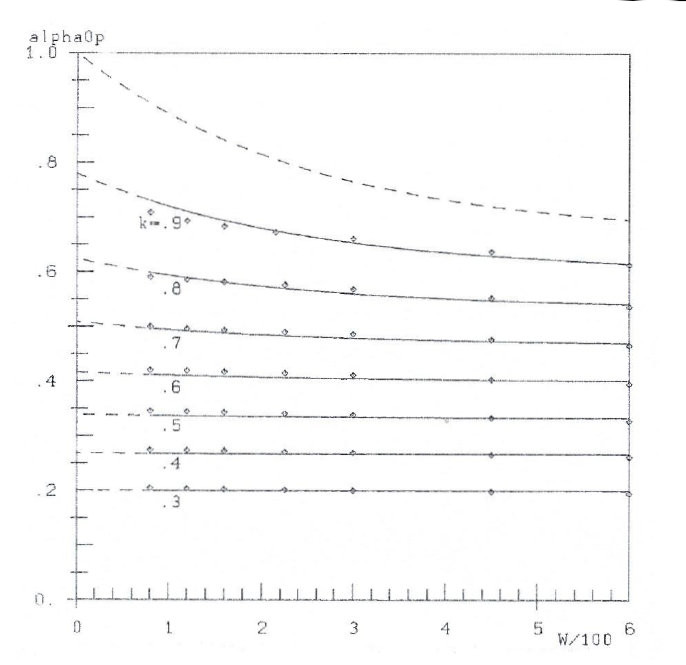
Fig. 5b: experimental points (W/100,![]() ) and hypothetical curves (W/100,
) and hypothetical curves (W/100,![]() )
)

Fig. 5c: experimental points (κ,![]() ) and hypothetical curves (κ,
) and hypothetical curves (κ,![]() )
)
Hypothesis H3 for the stress-strain relation with non-centric loading:
![]()
"The stress-strain relationship for non-centric loading is the same as that for centric loading".
See [4].
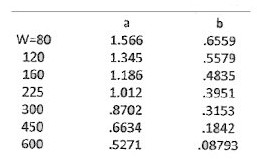
The (now 63) experimental data (ε0, κ) are given in table 3a, lines 1 and 2, the hypothetical results ![]() in line 3. The parameters a and b for 7 values of W are given in table 3b. Figure 6b shows the correspondence of data and hypothesis.
in line 3. The parameters a and b for 7 values of W are given in table 3b. Figure 6b shows the correspondence of data and hypothesis.
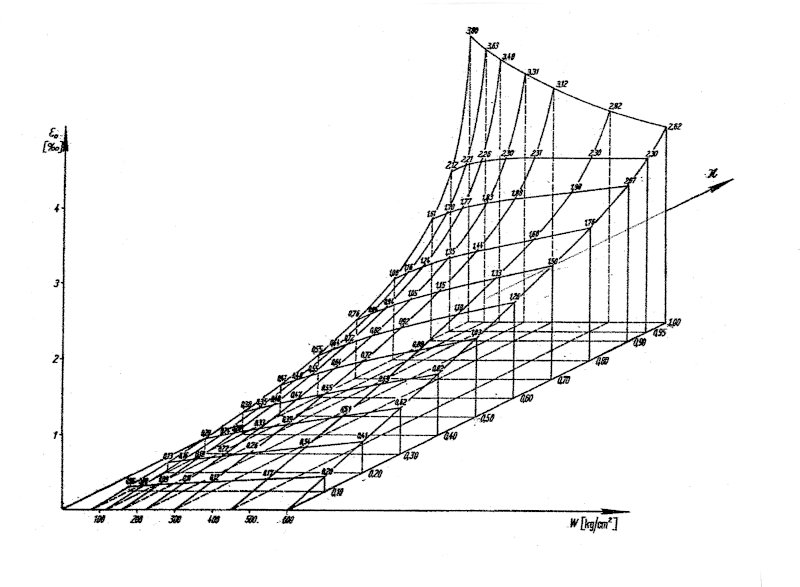
Fig. 6a: Dependence of the edge compression ε0 on the strength of the cube and the degree of loading κ of the bending pressure body
Table 3a: first lines: experimental values ε0, second lines: experimental values κ, third lines: hypothetical values ![]()
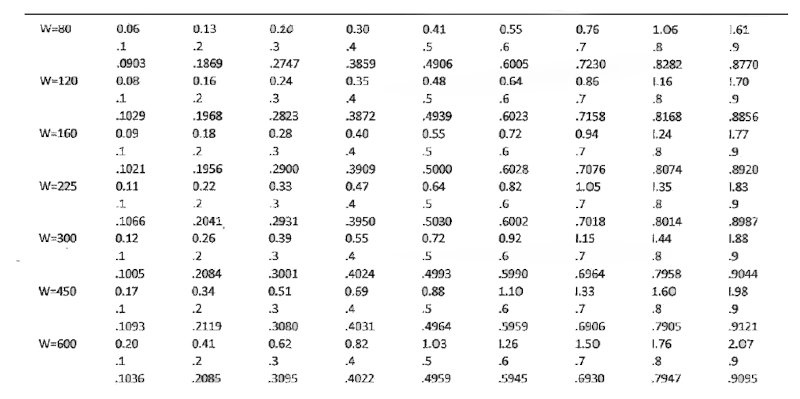

Fig. 6b: experimental points (ε, κ) and hypothetical curves (ε0,![]() )
)
Table 3b: Parameters of hypothesis ![]()
In a following part III I will bring a theory of the distribution of the stress across the bending pressure zone - on the basis of these hypotheses.
Acknowledgement
I state,that this analysis could not have been done without the grand work of Rüsch and his assistants. In hard times - before 1955 . He initiated, carried through and analysed - with the then available means - an immense scientitific program, the results of which are concentrated in his 3 resulting figures 112/113/114, the basis of this work.
References
[1] Nelder, J.R. and Mead, R. (1965). A Simplex Method for function minimization. The Computer Journal, 7, 303-313.
[2] Prentis, J.M. (1951). The distribution of concrete stress in reinforced and prostrained concrete beams, when tested to destruction by a pure bending moment. University of London: City of Guilds College
[3] Rüsch H. (1955). Versuche zur Festigkeit der Biegedruckzone. Deutscher Ausschuß für Stahlbeton, Heft 120
[4] Schneeberger H. (2020). Hooke's Law: Nonlinear Generalization and Applications. Part I: The generalized law:
Download this paper as PDF
Download this Paper in PDF format:
Hooke's Law: Nonlinear Generalization and Applications. Part 2: Parameters of the Bending Pressure Zone of a Beam [PDF, 832 kB]